In the fight against COVID-19, one of the best weapons at our disposal is data. But interpreting COVID-19 data isn’t always cut and dry. There’s no blueprint for a novel virus; instead, the global scientific community has had to sift through complex and ever-evolving data and, bit by bit, begin to assemble an understanding of how this virus works.
Ángel Alberto Aponte is one such data scientist on the frontlines of COVID-19 research. Through advanced machine learning (ML) techniques and the use of key technologies like Designer Cloud, Ángel has built a COVID-19 Diagnosis Tool that helps healthcare professionals better respond to COVID-19 cases.
We sat down with Ángel to learn more about the COVID-19 Diagnosis Tool, why data preparation was a big challenge in building it, and how he uses the Designer Cloud data preparation platform.
What’s the purpose of a COVID-19 Diagnosis Tool?
Our objective was to construct an interactive Tableau dashboard that visually detailed patients suspected of having COVID-19, the actual findings (whether they had COVID-19 or not), and ensuing treatment responses. With real-time information about cases, healthcare professionals could better identify patterns, understand anomalous cases, deliver key recommendations for new cases, effectively manage resources, and much more. The image below depicts the Dashboard´s main panel:
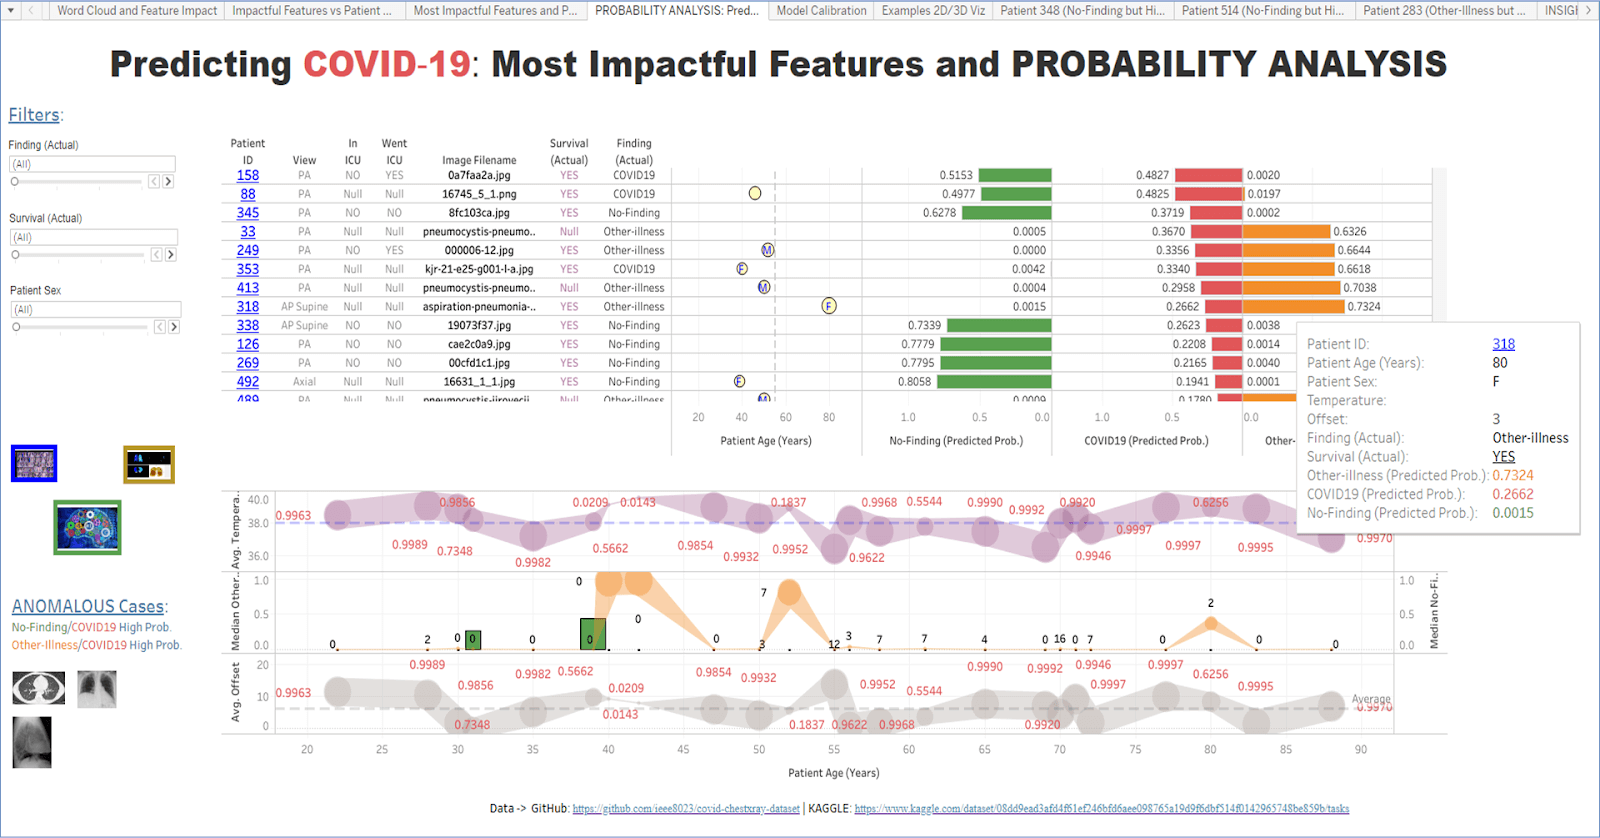
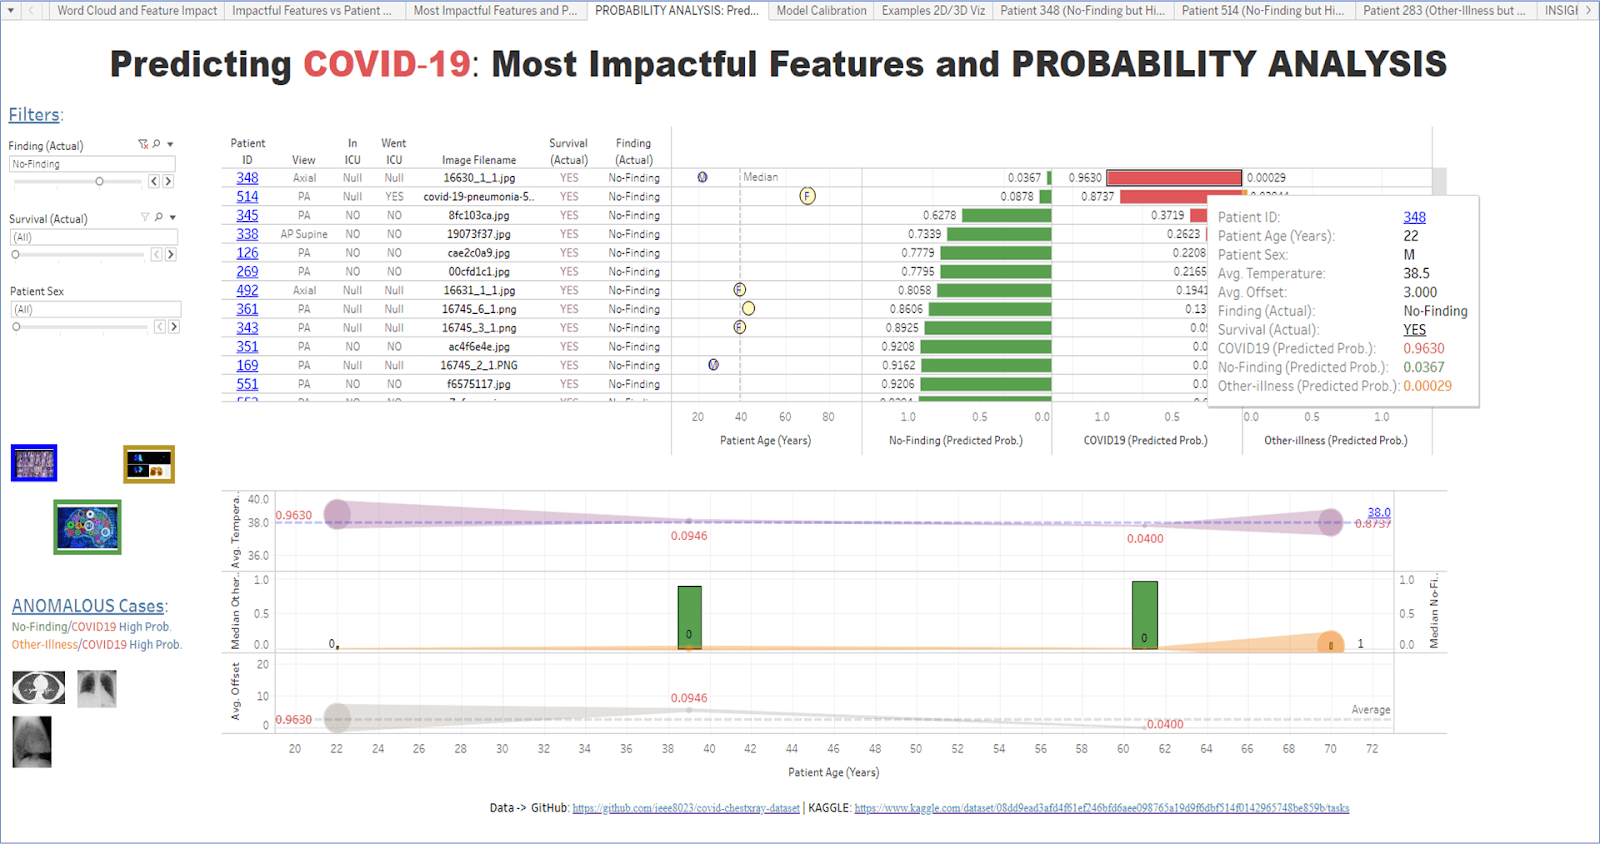
Data visualizations provide clarity for healthcare professionals by visually indicating exactly where treatment responses could be improved or changed. For example, some of the labels read “NoFinding” (or “OtherIllness”), yet have a high COVID19 Predicted Probability. That suggests that they are misclassified cases and could prompt healthcare professionals to bring those discharged patients back to the hospital for continued testing or treatment.
Why was data preparation a challenge in building a COVID-19 Diagnosis Tool?
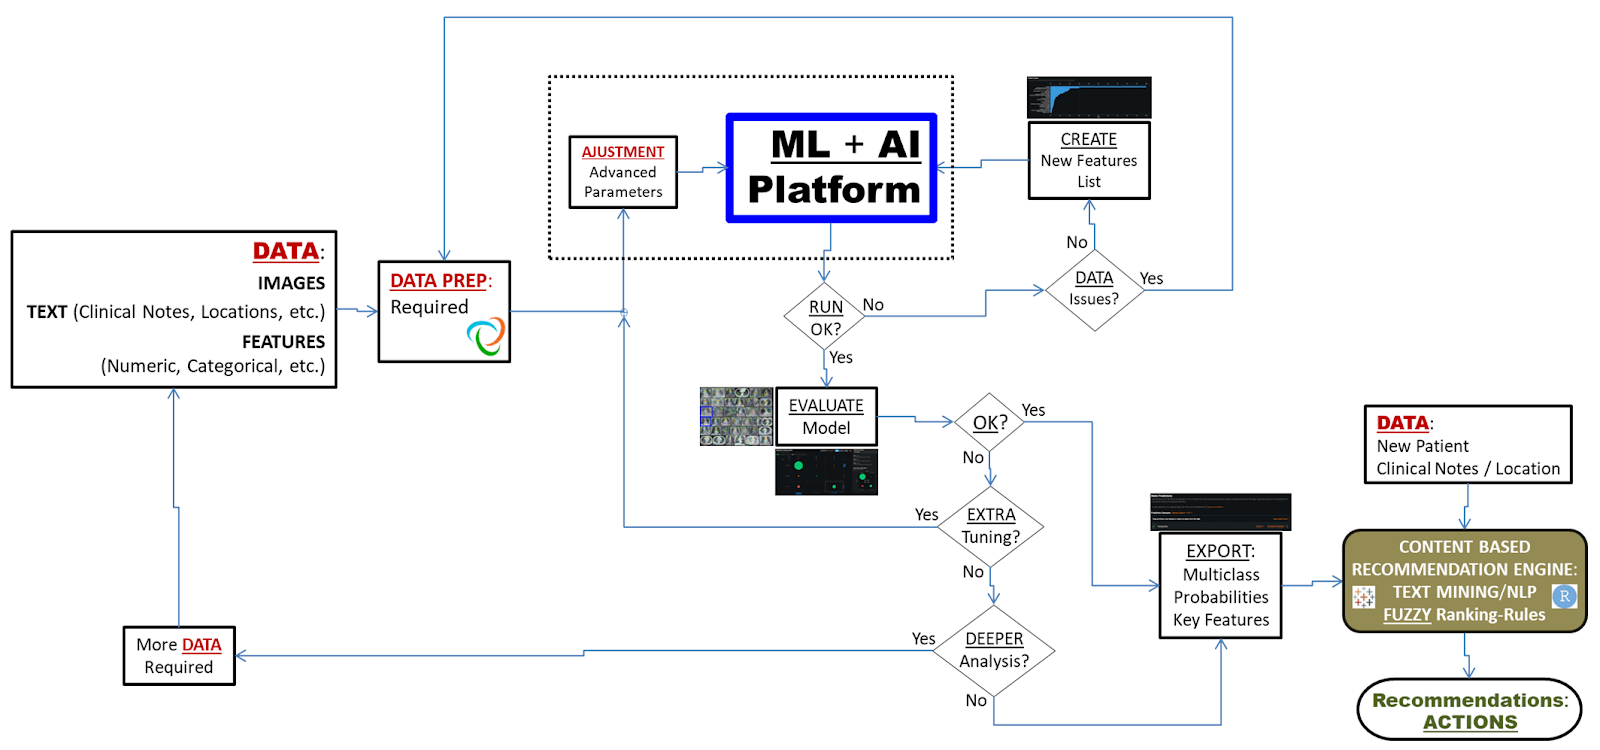
In order to populate the Diagnosis Tool, we built a machine learning/artificial intelligence platform derived from a multiclass classification model that delivers solid predicting power. The figure below illustrates the general workflow implemented:
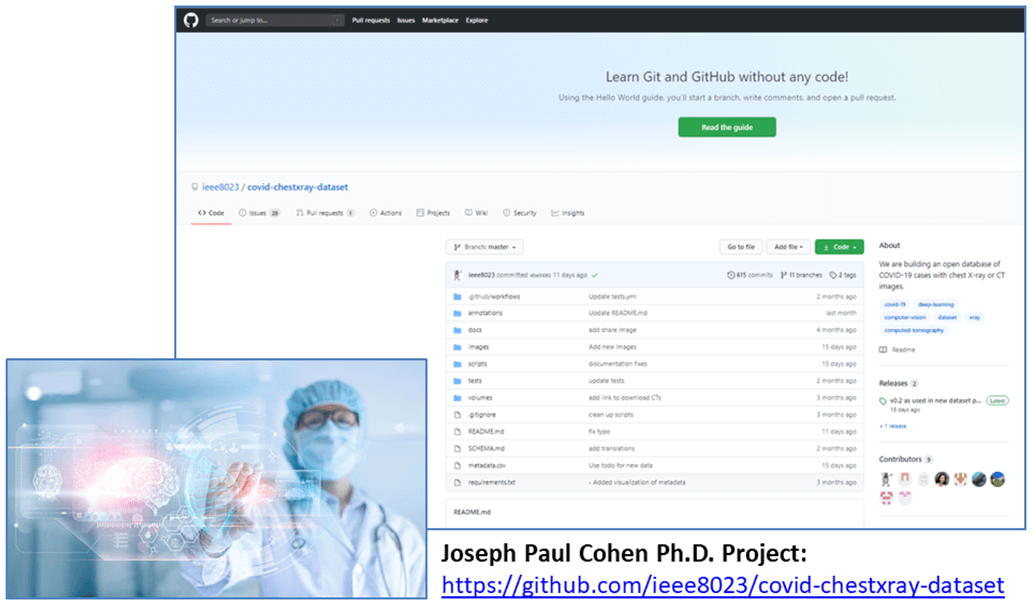
Of course, any sound machine learning model is the result of huge volumes of training data. In this case, the input dataset is a heterogeneous structured-unstructured dataset from the Joseph Paul Cohen Ph.D. project (Postdoctoral Fellow, Mila University of Montreal). It contains a huge variety of data types and structures, such as images of chest X-rays and CT scans, clinical notes (in text format), geographic locations, and other relevant numeric and categorical features.
Because of the size and complexity of this data, one of our biggest challenges in building the Diagnosis Tool was ensuring that all of this data was properly prepared. It was imperative that we get this step right, otherwise we couldn’t trust our data, which meant we couldn’t trust our analysis. And in this case, the results of our analysis could mean life or death.
In working with this dataset, some of our many data preparation tasks included:
- Data matching
Images names, clinical notes, and geographic locations must carefully be matched with findings (COVID19, NoFinfing, OtherIllness), as well as other patients´ key features, and integrated into a data table for the modeling process and other analyzes. Any mismatch could generate inaccurate predictions, resulting in a patient not receiving the critical care they need. - Standardizing inconsistencies
For example, this could include standardizing how patient temperatures are recorded (Fahrenheit vs Celsius degrees). - Blending heterogeneous data tables
Different databases use different naming conventions to name the data they collect. Although it was the same information, we needed to standardize the way this data was named. - Cleaning data text
This often included clinical notes, which were our primary source of information of patient symptoms, as recorded by healthcare professionals. - Feature engineering
For example, extracting relevant information from patients´ geographic locations and creating features with special formats to construct the Recommendation System (CBRE) and the Weighted Association Rules Mining Algorithms used in Survival Analysis.
Why did you choose Trifacta for data preparation?
Preparing data under traditional hand-coding methods took weeks and we simply did not have that kind of time—patients need optimized care now, not in weeks.
We considered using Tableau for data preparation, since we were already using it for data visualization, but realized that the built-in data connectors in Tableau don’t actually store data. And since we wanted to build a single source of truth in BigQuery Cloud Data Warehouse and be able to reuse it, that wasn’t going to work for us. We needed access to a lot of data and didn’t want to be reliant on a visualization tool that wouldn’t be able to scale. Quite simply, visualization tools are just not well-suited for data prep.
Having data preparation in the cloud allows us to scale on demand with absolutely no need for tuning. With the machine learning-powered Trifacta data preparation platform, we reduced our time spent preparing data from weeks to matter of days—or even hours. Its visual nature allowed us to explore and interact with our data, and we could easily store the list of steps involved in our data preparation process, or what Designer Cloud calls a “recipe.”
Once our recipes were completed, they could be modified, copied, shared, and reused as many times as necessary for the model. And in the event that any issues were detected in the pipeline, it was possible to quickly access the recipe(s) and fix them, export the data table again, and rebuild the model(s). Finally, we were able to carry out all the processes described here in the cloud and at scale.
Here’s an example of how we used Designer Cloud to prepare a data table required for the Weighted Association Rules Mining algorithms, used in the Survival Analysis.
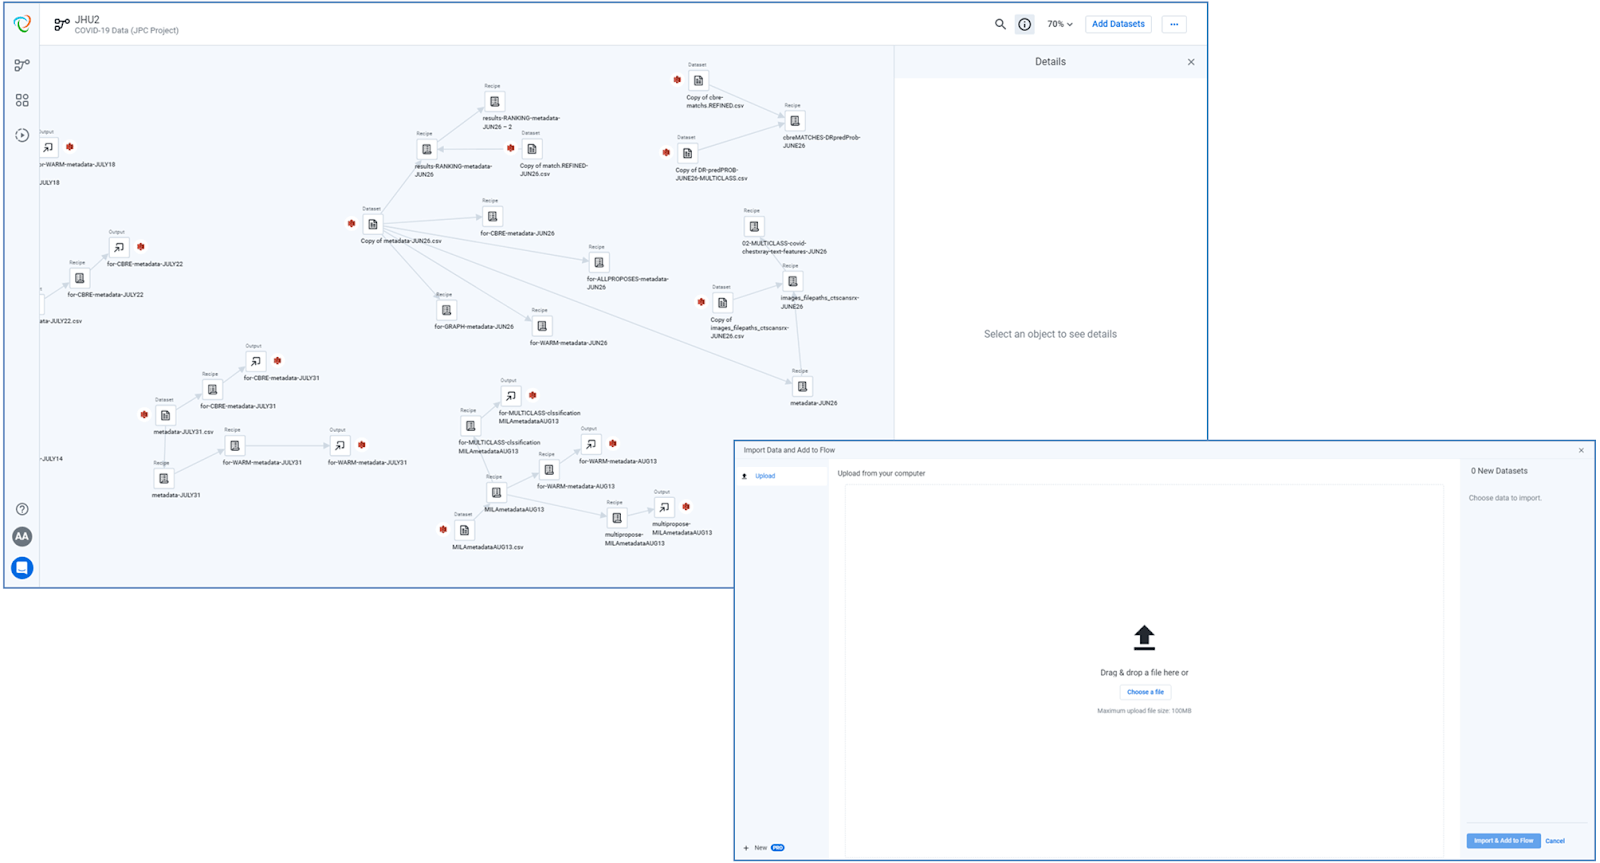
First, from the original data repository, the metadata file is downloaded:
Next, the metadata file is uploaded in Designer Cloud, where it will be, as mentioned before, cleaned, structured, standardized, etc.; and if necessary blended with other relevant information:
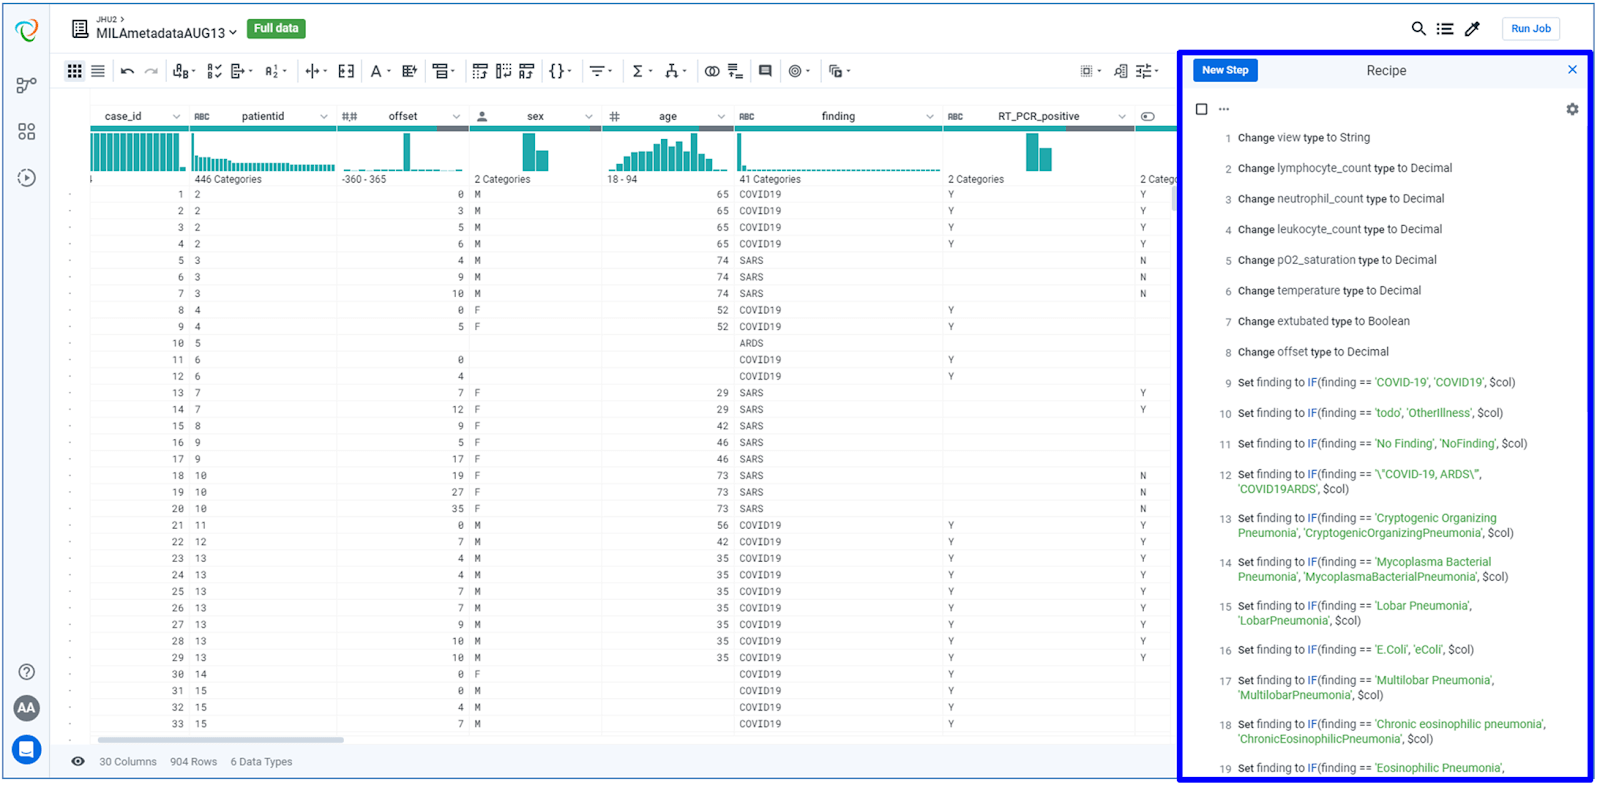
As all the logic applied in the data preparation process are stored in a reusable recipe:
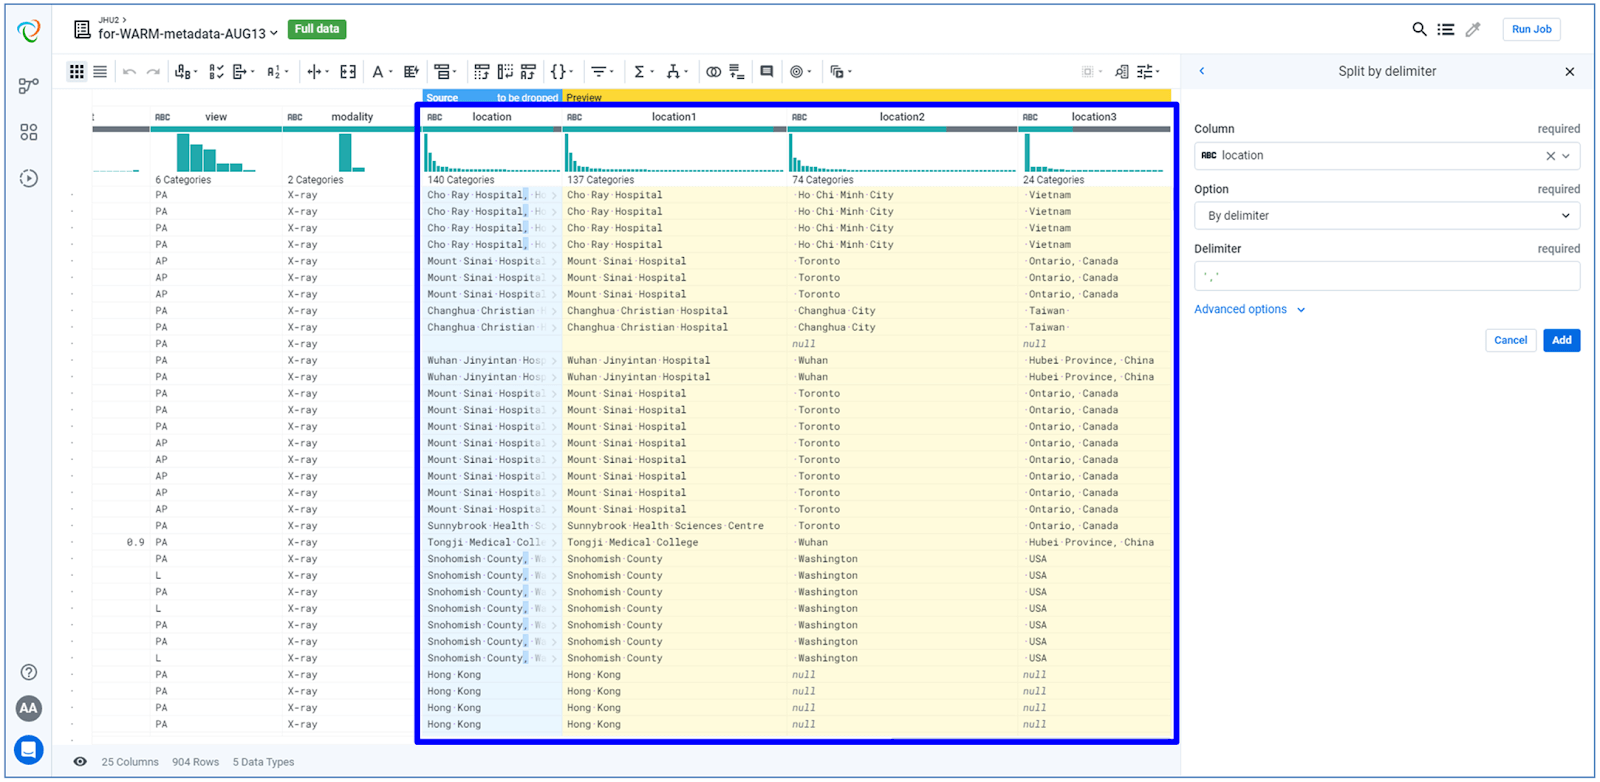
After completing the previous steps, it was also necessary to create new relevant features from the existing data, and extract key information from some of the available features (feature engineering). The figure below illustrates an example of how we split the geographic location column in order to extract a summary of the patients´ location details. This is a fairly complicated task, but in Trifacta we did it in just a few clicks.
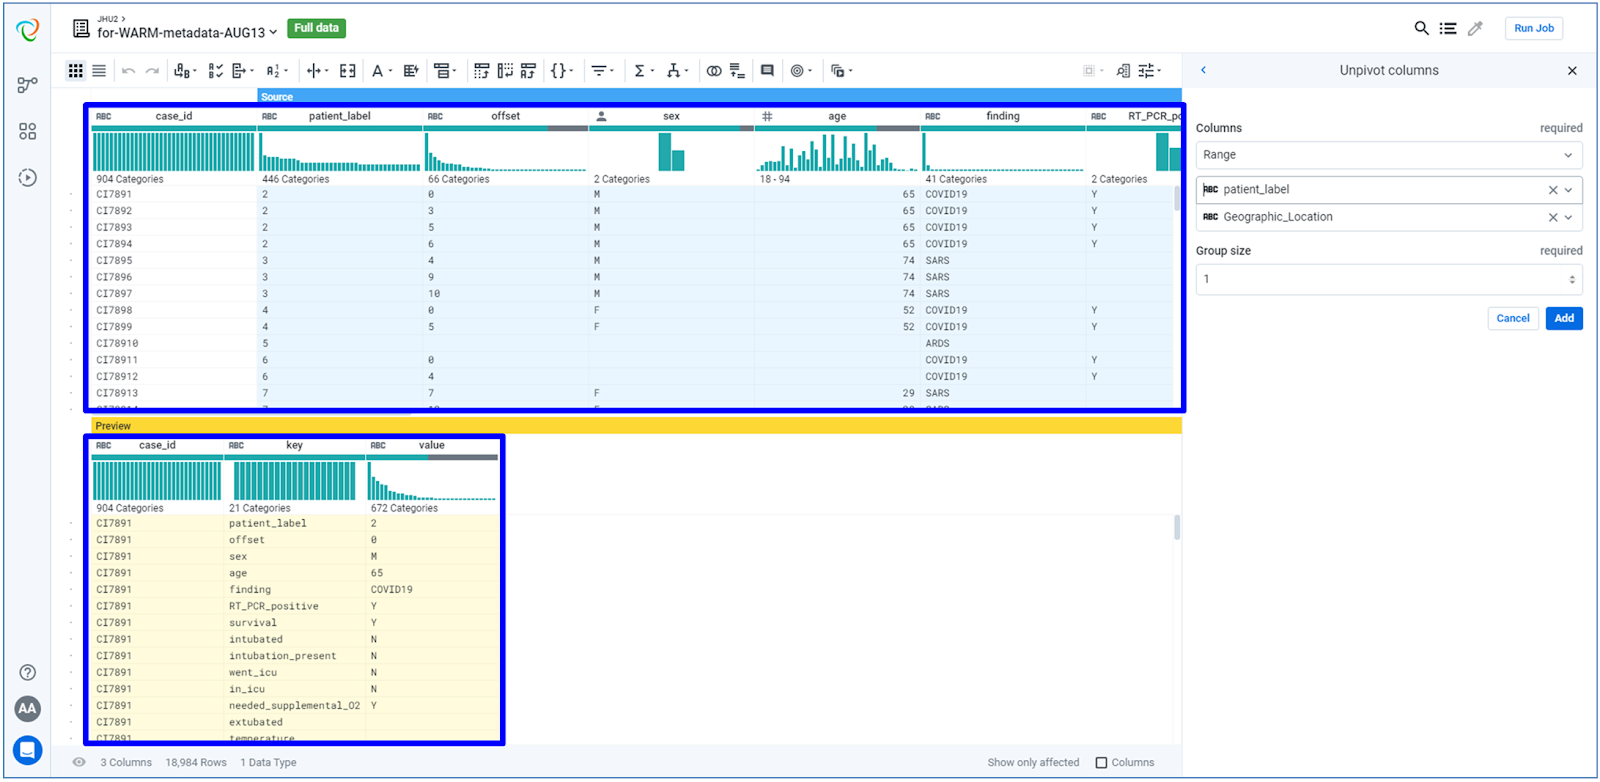
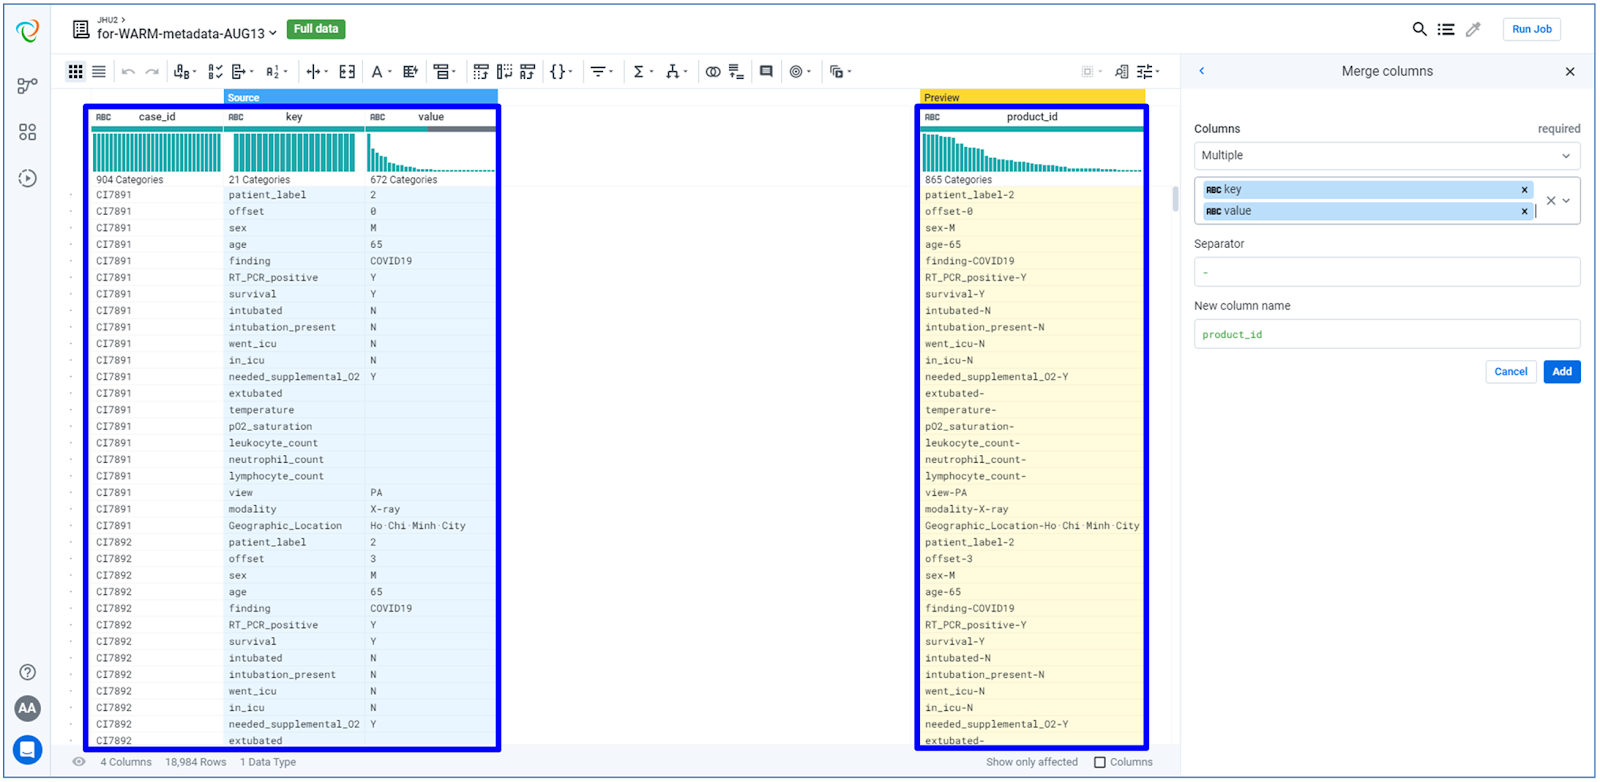
The information extracted is integrated with other patients´ important data, such as the results of RT-PCR tests, if the patient was intubated or not, if he/she survived, etc. Finally, the original and new features are unpivoted, as depicted in the images below:
What did you discover from the data you did not expect at all?
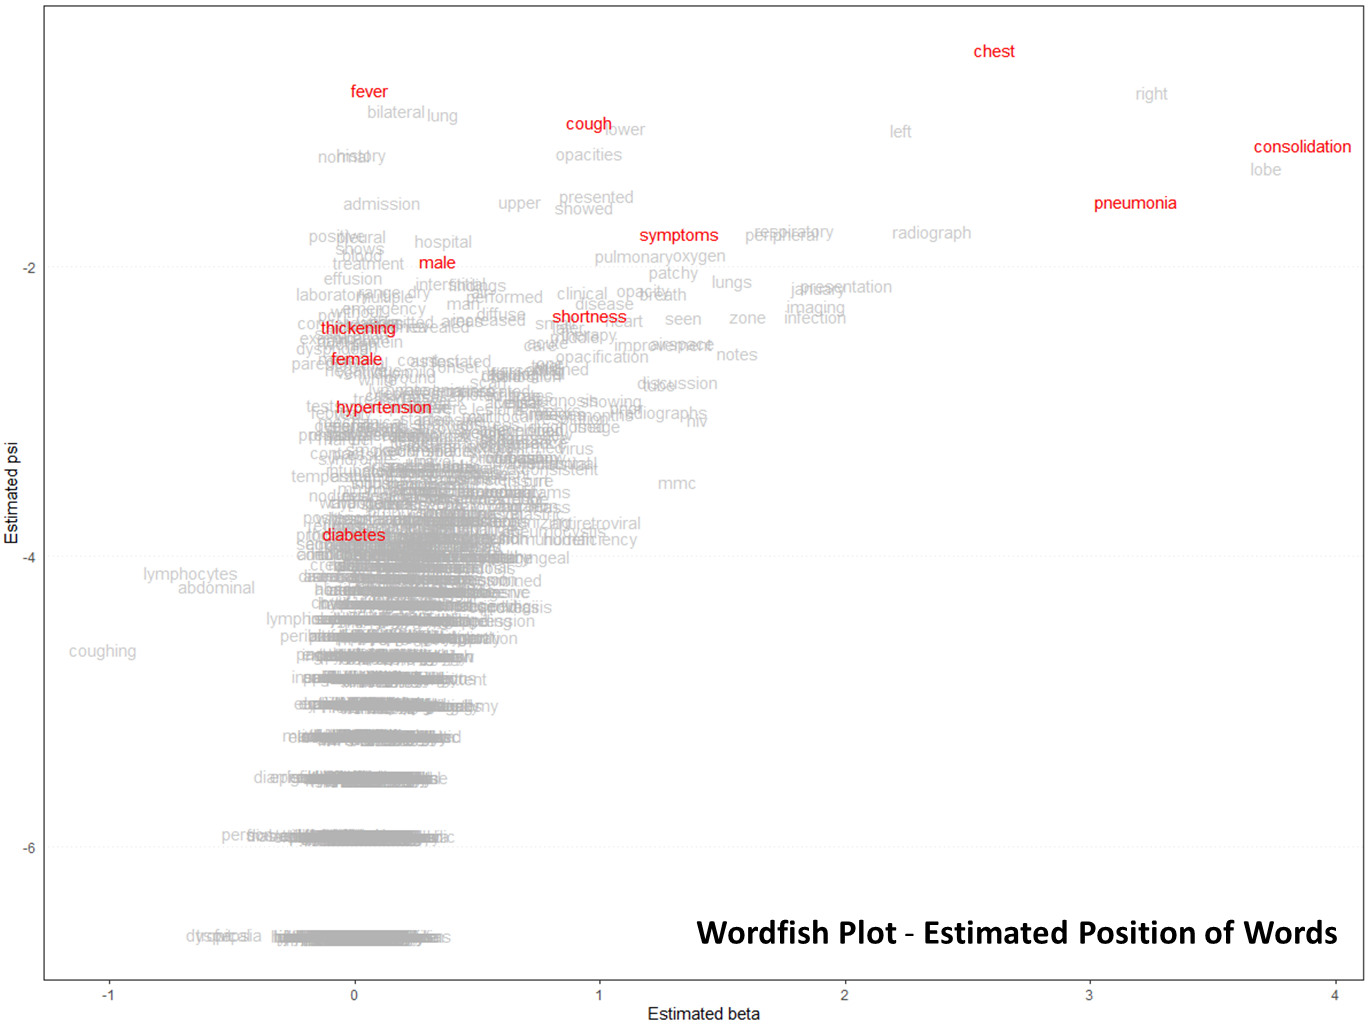
By creating a “Wordfish Plot,” we were able to track the words that are most often associated with COVID-19—the higher the words are in the plot, the more likely they are related to this devastating illness. There were expected results, such as “cough” or “fever,” but the negative impact of diabetes and hypertension really stood out to us as unexpected.
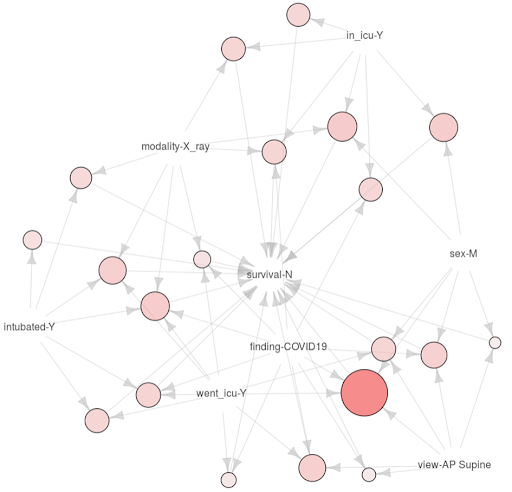
In addition, perhaps one the most unexpected and striking patterns that emerged systematically was the close relationship of male COVID-19 patients, in particular, with factors related to the likelihood of NOT SURVIVAL, such as the need for incubation, time spent in the ICU, etc. The oriented-graph-type plot below (a collection of nodes and edges represented by arrows), which takes into account Weighted Association Rules Mining Techniques, depicts the patterns in question and their relationships.
Any final takeaways?
When it comes to COVID-19, healthcare professionals are dealing with uncharted territory, which means resources like the COVID-19 Diagnosis Tool are instrumental in empowering them to treat patients logically and quickly. And at the heart of the COVID-19 Diagnosis Tool is data—data that must be properly prepared in order to be effective.
We’re using the Designer Cloud data preparation platform to not only operationalize and accelerate the data preparation process, but also visually ensure that each new dataset is properly cleansed and structured in order to help power our collective understanding of this virus. Now, healthcare providers are not waiting weeks for new insights, but instead mere hours.
If you are interested in learning more about the data preparation involved in this particular project or other associated ongoing projects, please contact: [email protected]. And to learn more about the Designer Cloud data preparation platform, schedule a demo or start using Designer Cloud today.